

Don't believe what they say about inequality. Some of us are worse off
- Written by: Peter Whiteford, Professor, Crawford School of Public Policy, Australian National University
If you were going to reduce a 150-page Productivity Commission examination of trends in Australian inequality to a few words, it would be nice if they weren’t “ALP inequality claims sunk”, or “Progressive article of faith blown up” or “Labor inequality myths busted by commission”.
The editorial in the Australian Financial Review of August 30 says questions about whether inequality is increasing are “abstract”, taught in universities as “an article of faith”, and a “political truncheon”.
Here I should disclose that I teach courses covering inequality as well as undertaking research on the topic. Also, I was one of the external referees for this week’s Productivity Commission report.
It adds to a growing pile of high quality research on trends in income distribution in Australia, including a recent Australian Council of Social Service (ACOSS) and University of New South Wales study using data from the Australian Bureau of Statistics (ABS) that provides an in-depth analysis of income and wealth inequality in 2015-16 and an analysis of trends since 2000.
Also released at the end of July was the latest HILDA Statistical Report that analyses how things have changed over time for individuals between 2001 and 2016.
The Productivity Commission survey takes the deliberately ambitious approach of assessing a wider range of outcomes than income, including indicators of household consumption and wealth, their components, and changes over time and in response to events such as transitions to work, divorce and retirement.
 Rising inequality? A stocktake of the evidence, Productivity Commission 2018, CC BY
Much of the reporting seems to have misread the messages the survey and the Chairman’s speech to the National Press Club were trying to emphasise. For example, the editorial in the Financial Review argues the Commission’s report shows “economic growth has made everyone in Australia in every income group better off”.
Well, no, it doesn’t.
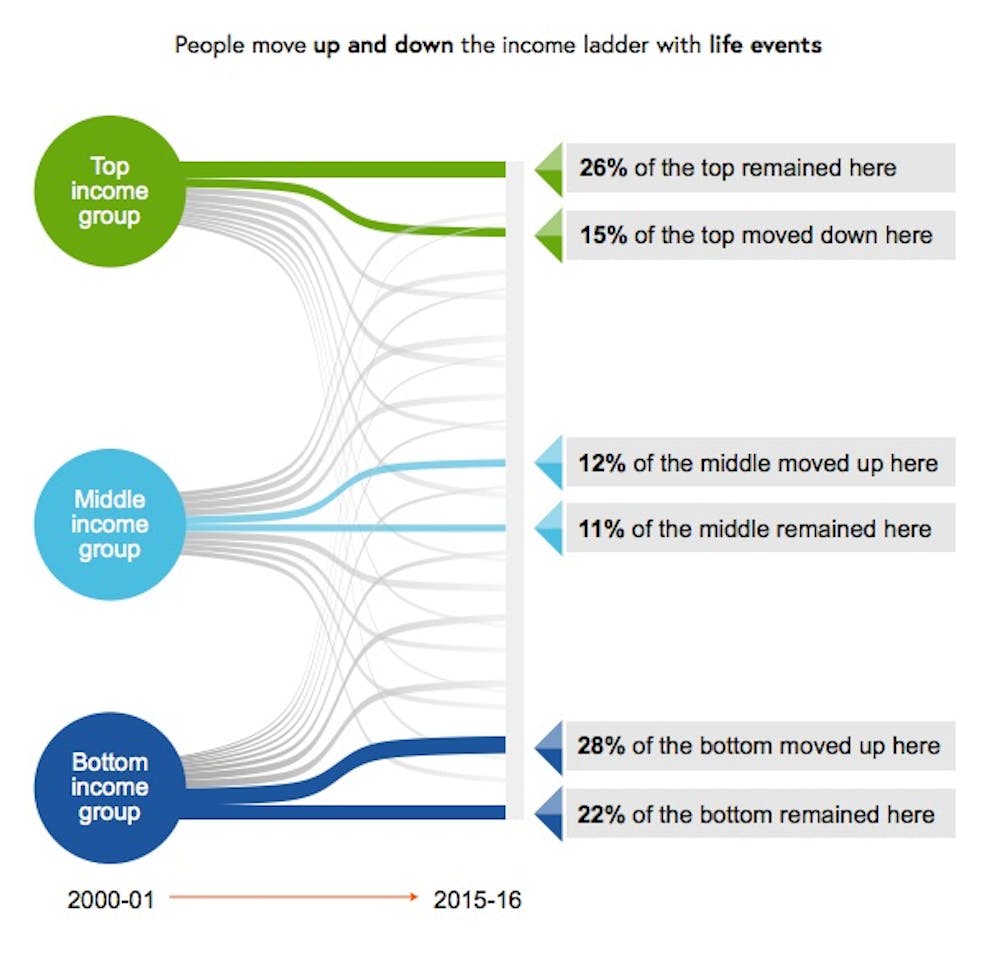
The finding that every income group has benefited from income growth should not be interpreted as meaning every person in Australia is better off. The discussion of mobility in the report makes the point that the incomes of households and individuals fall as well as rise.
Put simply, not everyone – in fact very few (about 1%) – stay in exactly the same place. Table 5.1 (page 96) shows more than 40% of the Australian population were in a lower income group in 2016 than they had been in 2001, for reasons ranging from retirement to disability to unemployment to family breakdown.
Rising inequality? A stocktake of the evidence, Productivity Commission 2018, CC BY
Much of the reporting seems to have misread the messages the survey and the Chairman’s speech to the National Press Club were trying to emphasise. For example, the editorial in the Financial Review argues the Commission’s report shows “economic growth has made everyone in Australia in every income group better off”.
Well, no, it doesn’t.
The finding that every income group has benefited from income growth should not be interpreted as meaning every person in Australia is better off. The discussion of mobility in the report makes the point that the incomes of households and individuals fall as well as rise.
Put simply, not everyone – in fact very few (about 1%) – stay in exactly the same place. Table 5.1 (page 96) shows more than 40% of the Australian population were in a lower income group in 2016 than they had been in 2001, for reasons ranging from retirement to disability to unemployment to family breakdown.
 Productivity Commission, CC BY
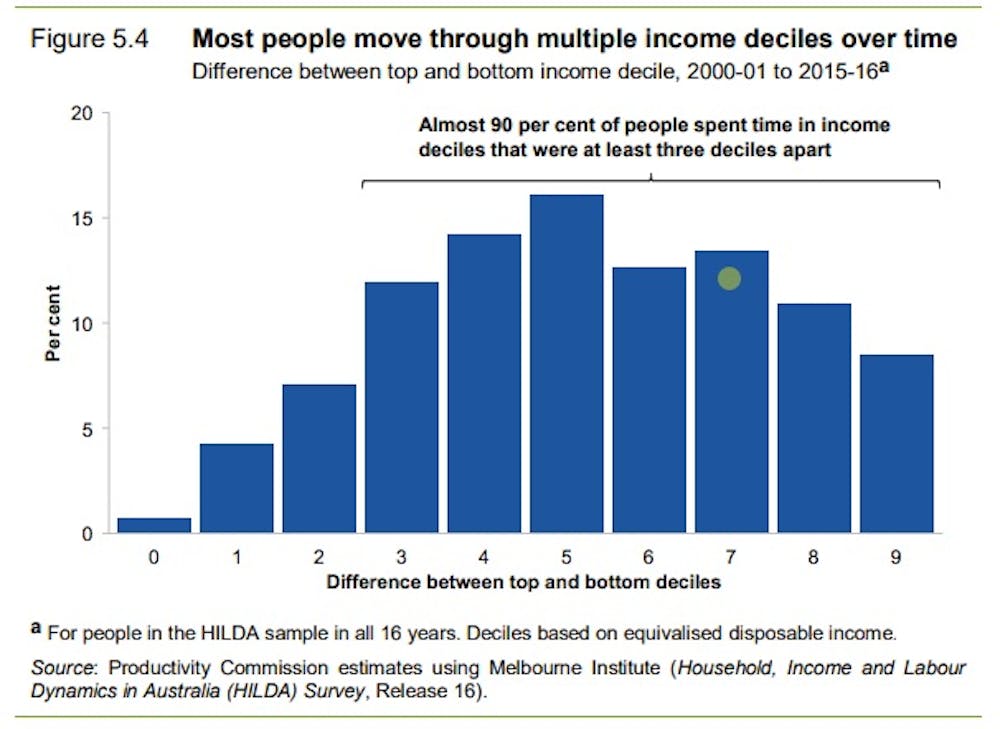
Single adults on Newstart, although not the same people, have fallen down the income distribution over the past 25 years, from around the bottom 10% to the bottom 5%. As another example, someone who worked on a manufacturing production line until it was closed and then got a job as a sales assistant would be better paid than a sales assistant used to be but most certainly not better paid than they used to be. They would have little reason to believe the Financial Review.
And as the Commission was at pains to point out, the stabilisation and slight decline in overall inequality over the past decade is to a large extent the result of specific government decisions.
One of the most important was the one-off increase in age pensions by the Rudd government in 2009. The 2016 ACOSS report on poverty found the relative poverty rate (before housing costs) for people aged 65 and over fell from around 30% in 2007-08 to 11% in 2013-14, due to the “historic increase” in pension rates.
ABS income surveys show the average incomes of households headed by people aged 65 and over climbed by 16% in real terms between 2007-08 and 2015-16, while for the population as a whole the increase was about 3%. As a result, the average incomes of older households jumped from 69% to 78% of those of households generally.
While economic prosperity was needed to fund that increase, it didn’t automatically fund it. That needed deliberate government intervention.
In his speech releasing the report, Commission chairman Peter Harris specifically noted “growth alone is no guarantee against widening disparity between rich and poor”.
Some forms of poverty for children “have actually risen”.
The slide in inequality resulting from the increase in the age pension is likely to have disguised increases in inequality elsewhere.
According to the Bureau since the global financial crisis the number of workers who are underemployed – working part time and wanting more hours - has climbed from about 680,000 to 1.1 million; from 6.3% to 8.9% of the workforce.
And the ABS finds wage disparities have increased. The ratio of the earnings of a worker at the 90th percentile (earning more than 90% of workers) to the earnings of a worker at the tenth percentile grew from 7.75 times in 2008 to 8.24 times in 2016. This was due to widening wage differentials for both full-time and part-time workers and an increase in the proportion of part-time workers
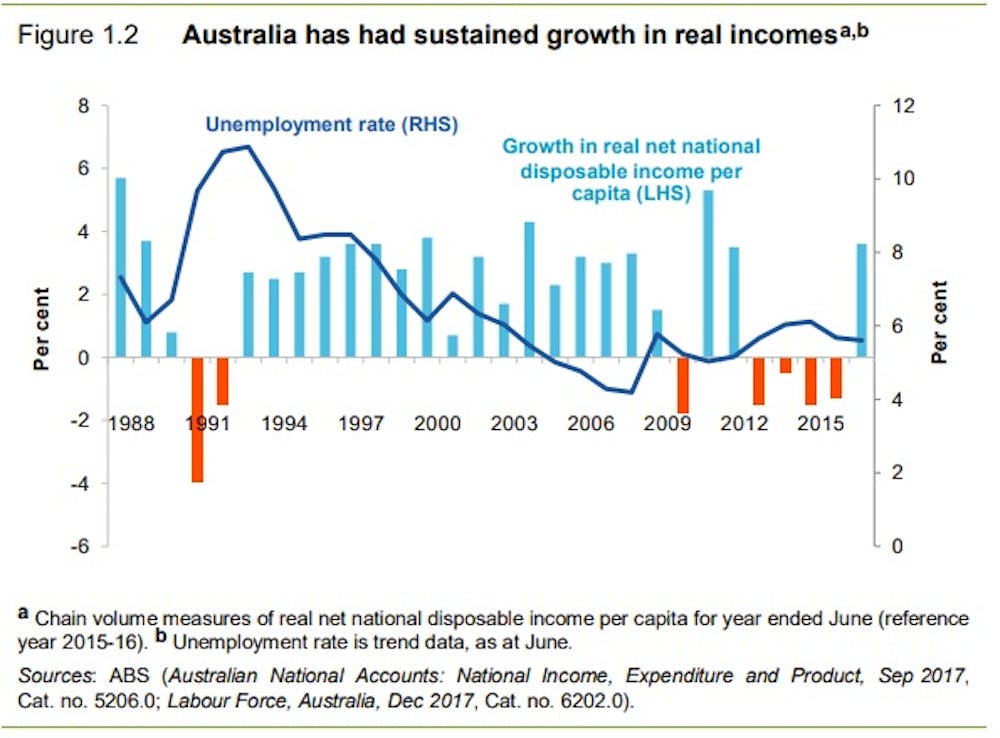
We often hear about Australia as a “miracle economy” enjoying 27 years of economic growth. In fact, the Commission report (Figure 1.2 page 13) shows real net national disposable income per person – a better measure of individual economic well-being than GDP – actually fell in six out of the last 27 years.
Productivity Commission, CC BY
Single adults on Newstart, although not the same people, have fallen down the income distribution over the past 25 years, from around the bottom 10% to the bottom 5%. As another example, someone who worked on a manufacturing production line until it was closed and then got a job as a sales assistant would be better paid than a sales assistant used to be but most certainly not better paid than they used to be. They would have little reason to believe the Financial Review.
And as the Commission was at pains to point out, the stabilisation and slight decline in overall inequality over the past decade is to a large extent the result of specific government decisions.
One of the most important was the one-off increase in age pensions by the Rudd government in 2009. The 2016 ACOSS report on poverty found the relative poverty rate (before housing costs) for people aged 65 and over fell from around 30% in 2007-08 to 11% in 2013-14, due to the “historic increase” in pension rates.
ABS income surveys show the average incomes of households headed by people aged 65 and over climbed by 16% in real terms between 2007-08 and 2015-16, while for the population as a whole the increase was about 3%. As a result, the average incomes of older households jumped from 69% to 78% of those of households generally.
While economic prosperity was needed to fund that increase, it didn’t automatically fund it. That needed deliberate government intervention.
In his speech releasing the report, Commission chairman Peter Harris specifically noted “growth alone is no guarantee against widening disparity between rich and poor”.
Some forms of poverty for children “have actually risen”.
The slide in inequality resulting from the increase in the age pension is likely to have disguised increases in inequality elsewhere.
According to the Bureau since the global financial crisis the number of workers who are underemployed – working part time and wanting more hours - has climbed from about 680,000 to 1.1 million; from 6.3% to 8.9% of the workforce.
And the ABS finds wage disparities have increased. The ratio of the earnings of a worker at the 90th percentile (earning more than 90% of workers) to the earnings of a worker at the tenth percentile grew from 7.75 times in 2008 to 8.24 times in 2016. This was due to widening wage differentials for both full-time and part-time workers and an increase in the proportion of part-time workers
We often hear about Australia as a “miracle economy” enjoying 27 years of economic growth. In fact, the Commission report (Figure 1.2 page 13) shows real net national disposable income per person – a better measure of individual economic well-being than GDP – actually fell in six out of the last 27 years.
 Productivity Commission
The income survey data show an even more mixed record. The Our World in Data database shows that by 2003 the real income of the median Australian household was only about 5% higher in real terms than in 1989, while the second and third decile households – mainly headed by those on low wages and some on social security – were actually no better-off than in 1989, largely due to the effects of the early 1990s recession.
Virtually all of the increase in real disposable household incomes enjoyed since 1989 (or 1981 for that matter) came in one five-year period, between 2003 and 2008 during the first mining boom.
What is striking about Australia compared to other countries is that since the global financial crisis we have largely maintained the income lift from the boom.
Will we be blessed by another boom to pump up the figures? Or might we be less lucky?
Despite the way it’s been spun, the Commission’s main message is that in the decades ahead we will need both policies that generate economic growth and policies that ensure it’s well spread. One without the other could leave many of us worse off.
Productivity Commission
The income survey data show an even more mixed record. The Our World in Data database shows that by 2003 the real income of the median Australian household was only about 5% higher in real terms than in 1989, while the second and third decile households – mainly headed by those on low wages and some on social security – were actually no better-off than in 1989, largely due to the effects of the early 1990s recession.
Virtually all of the increase in real disposable household incomes enjoyed since 1989 (or 1981 for that matter) came in one five-year period, between 2003 and 2008 during the first mining boom.
What is striking about Australia compared to other countries is that since the global financial crisis we have largely maintained the income lift from the boom.
Will we be blessed by another boom to pump up the figures? Or might we be less lucky?
Despite the way it’s been spun, the Commission’s main message is that in the decades ahead we will need both policies that generate economic growth and policies that ensure it’s well spread. One without the other could leave many of us worse off.
Authors: Peter Whiteford, Professor, Crawford School of Public Policy, Australian National University